Most people use their wearables to count steps and calories, but the real insights come from deeper metrics like heart rate variability, recovery scores, and sleep patterns. Here’s how to unlock the health data that actually matters and what it reveals about when to push harder versus when to rest.
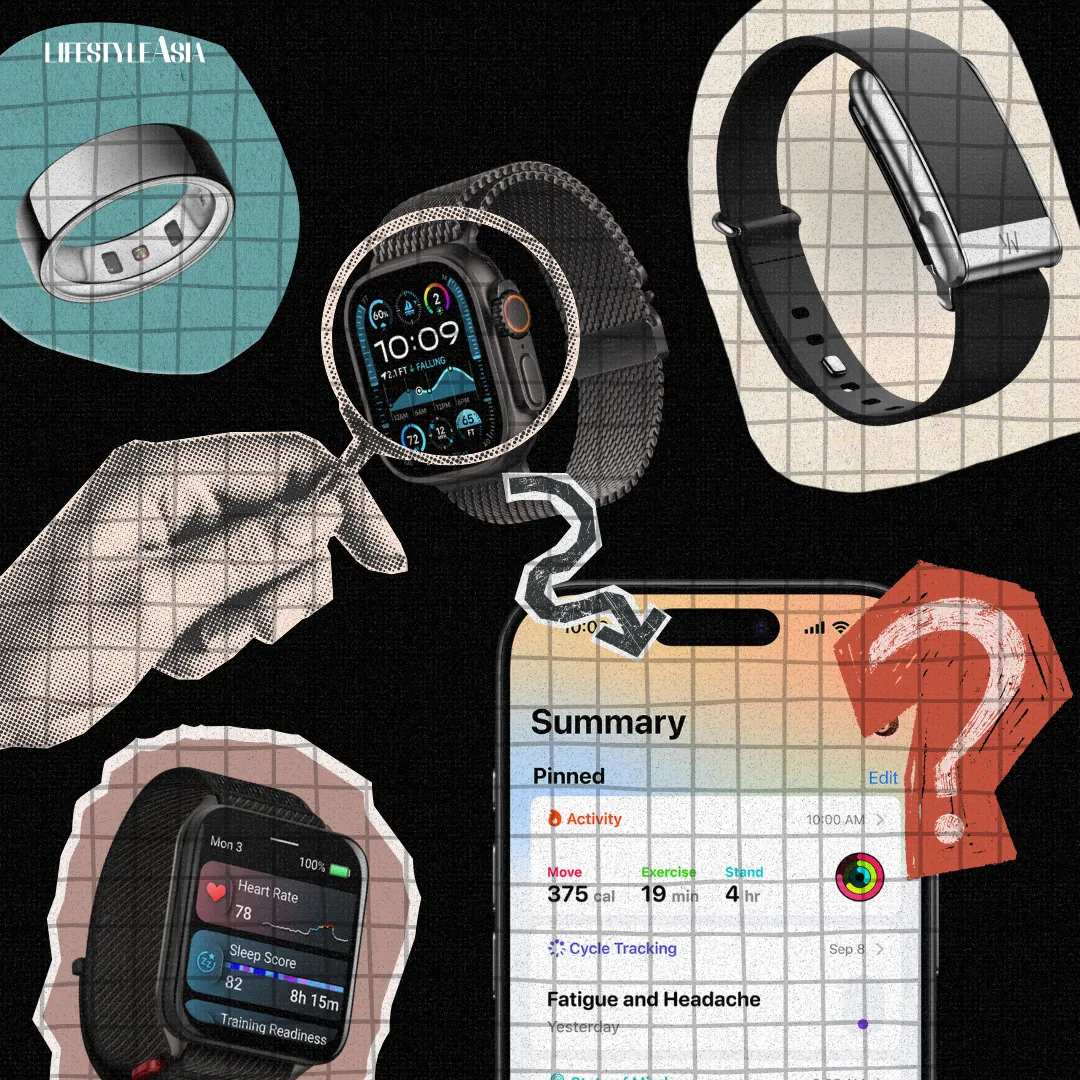
It’s hard to ignore the rise of wearables. From Garmin and Whoop to Oura and the Apple Watch, these devices are no longer just accessories; they’ve become everyday health companions. Each promises insights into how we move, sleep, and recover. Yet most people barely scratch the surface of what these devices can tell them. We check our step count, glance at calories burned, and call it a day.
Here’s what you might not know: steps and calories are just the beginning. The 10,000-step goal wasn’t even born from science; it was a 1960s Japanese marketing campaign for a pedometer called manpo-kei, or 10,000-step meter. Calorie burn numbers are rough estimates at best. The real insights come from deeper health metrics that can guide smarter decisions about when to push harder and when to rest.
Let’s break down the most valuable metrics across devices and what they actually reveal about your health.
Strain Or Activity: Balancing Effort And Rest
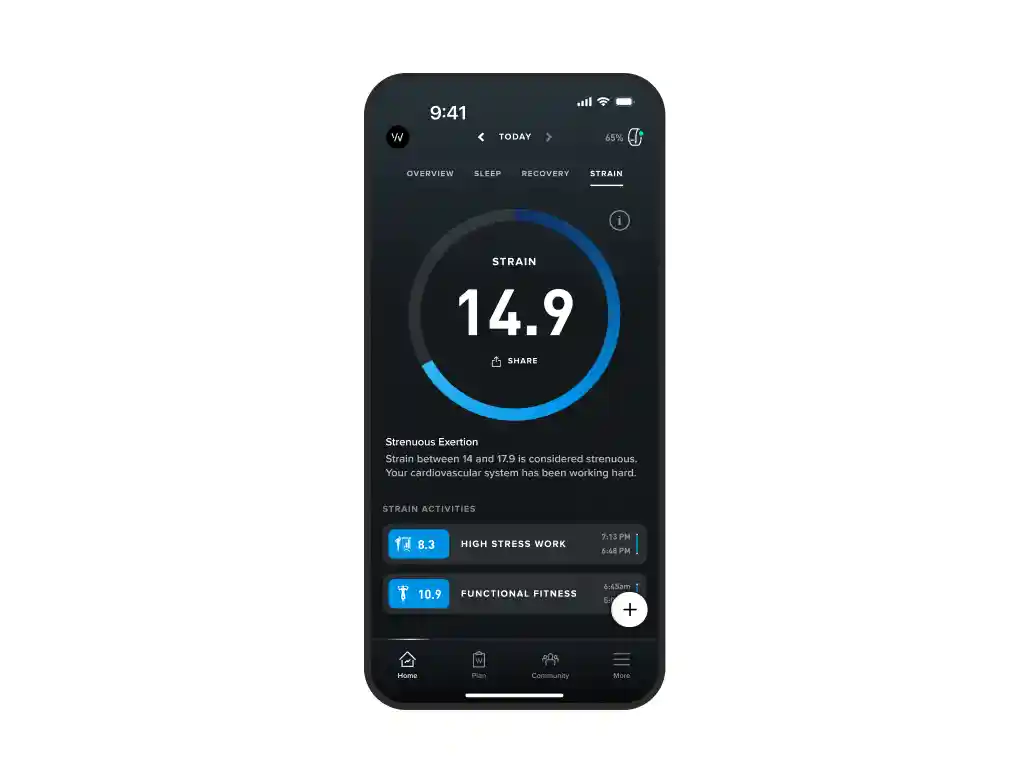
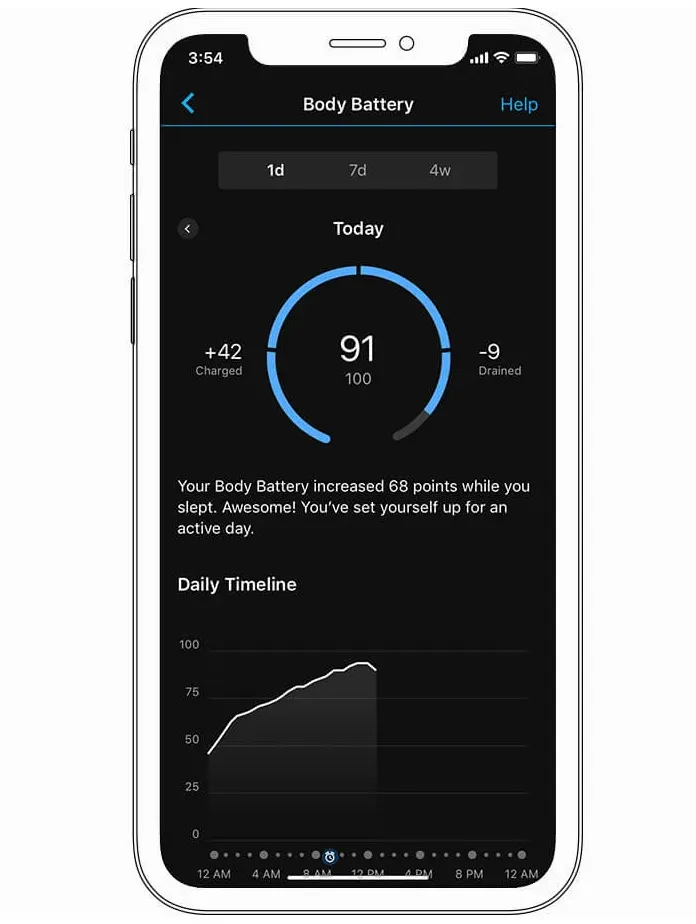
Different brands call it different things. “Strain” in Whoop, “Activity Rings” in Apple, or “Body Battery” in Garmin. The idea is the same: your wearable measures how much effort you’re putting into your day by combining movement, duration, and intensity based on heart rate and sometimes power output.
The mistake many people make is treating this like a high-score game, always pushing to “close the ring” or hit maximum strain. The real insight lies in balance. If you’re already feeling run down, stacking high-strain days can lead to burnout or injury. Conversely, too many low-activity days can slow progress. The key is learning to listen to your body—knowing when to push forward and when to ease up on days when something feels off.
Recovery: The Other Side Of The Equation
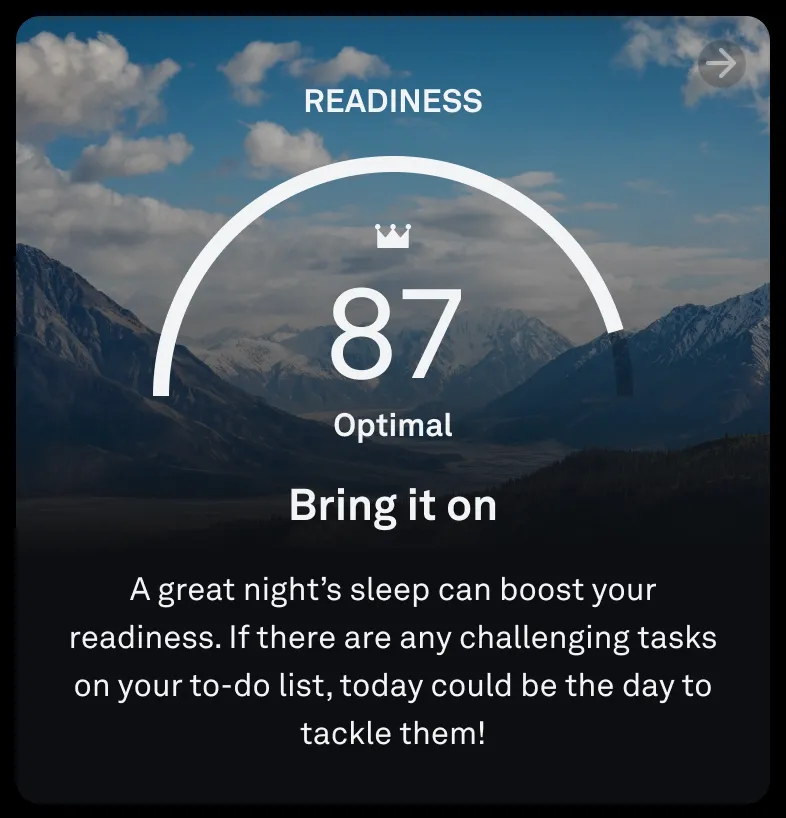
If strain is the gas pedal, recovery is the brake—and arguably more important. Whoop pioneered recovery scoring, but most platforms now include some form of it. Recovery metrics typically combine factors like sleep quality, resting heart rate, and heart rate variability (HRV) to give you a snapshot of how ready your body is to handle stress.
Think of it as a readiness gauge. A low recovery score doesn’t mean “do nothing,” but it signals the need to adjust. Swap a long run for an easy bike ride, or focus on mobility instead of heavy lifting. High recovery? That’s your green light to push harder. The key insight is understanding what influences your recovery score. Was it the late-night meal, disrupted sleep, or an especially intense training day? Identifying patterns helps you make better choices consistently.
Resting Heart Rate (RHR): Your Baseline Cardiovascular Health Indicator
One of the simplest but most telling numbers your wearable provides is your resting heart rate (RHR), which is how many beats per minute (bpm) when you’re at rest. A lower resting heart rate usually signals good cardiovascular health and efficient heart function. For most adults, a typical RHR ranges from 60 to 100 bpm, though trained athletes often fall in the 40 to 50 bpm range.
The real value lies in tracking changes over time. If your resting heart rate spikes compared to your normal baseline, it can be an early indicator of illness, dehydration, stress, or fatigue. This makes it one of the easiest ways to monitor your body’s subtle signals. When your RHR trends lower over time, it typically indicates improving cardiovascular health.
Heart Rate Variability (HRV): Your Stress Barometer
Heart rate variability (HRV) measures the tiny variations in time between your heartbeats. Higher variability generally indicates that your body is more adaptable, resilient, and recovered. Lower variability often signals stress, fatigue, or overtraining. Think of it as a window into how well your nervous system is balancing stress and recovery.
HRV is highly individual. It’s not about comparing your numbers to others, since everyone’s baseline is unique due to genetic and lifestyle factors. Instead, focus on your personal trends. If your HRV dips for several days in a row, it may be time to prioritize rest, hydration, or sleep.
Wearables like Whoop and Oura highlight HRV as a cornerstone of their recovery scores, and there’s good reason for this focus. Whoop itself was born out of founder Will Ahmed’s fascination with HRV while studying at Harvard—he became obsessed with how recovery could be measured and turned that insight into the company’s core metric. HRV reflects the balance between your sympathetic nervous system (fight or flight mode) and your parasympathetic nervous system (rest and digest mode), giving you insight into how well your body is managing the balance between stress and recovery.
SpO₂: Blood Oxygen Saturation
Most modern wearables now measure SpO₂, or blood oxygen saturation levels. A typical healthy range is 95 to 100%. While daily fluctuations are normal, consistently low readings can indicate issues like sleep apnea, respiratory problems, or altitude adaptation challenges.
For most users, SpO₂ serves as more of a health monitoring tool than a daily performance metric. If you notice frequent dips, especially during sleep, it’s worth consulting with a healthcare provider or evaluating your sleep environment.
Sleep And Sleep Score
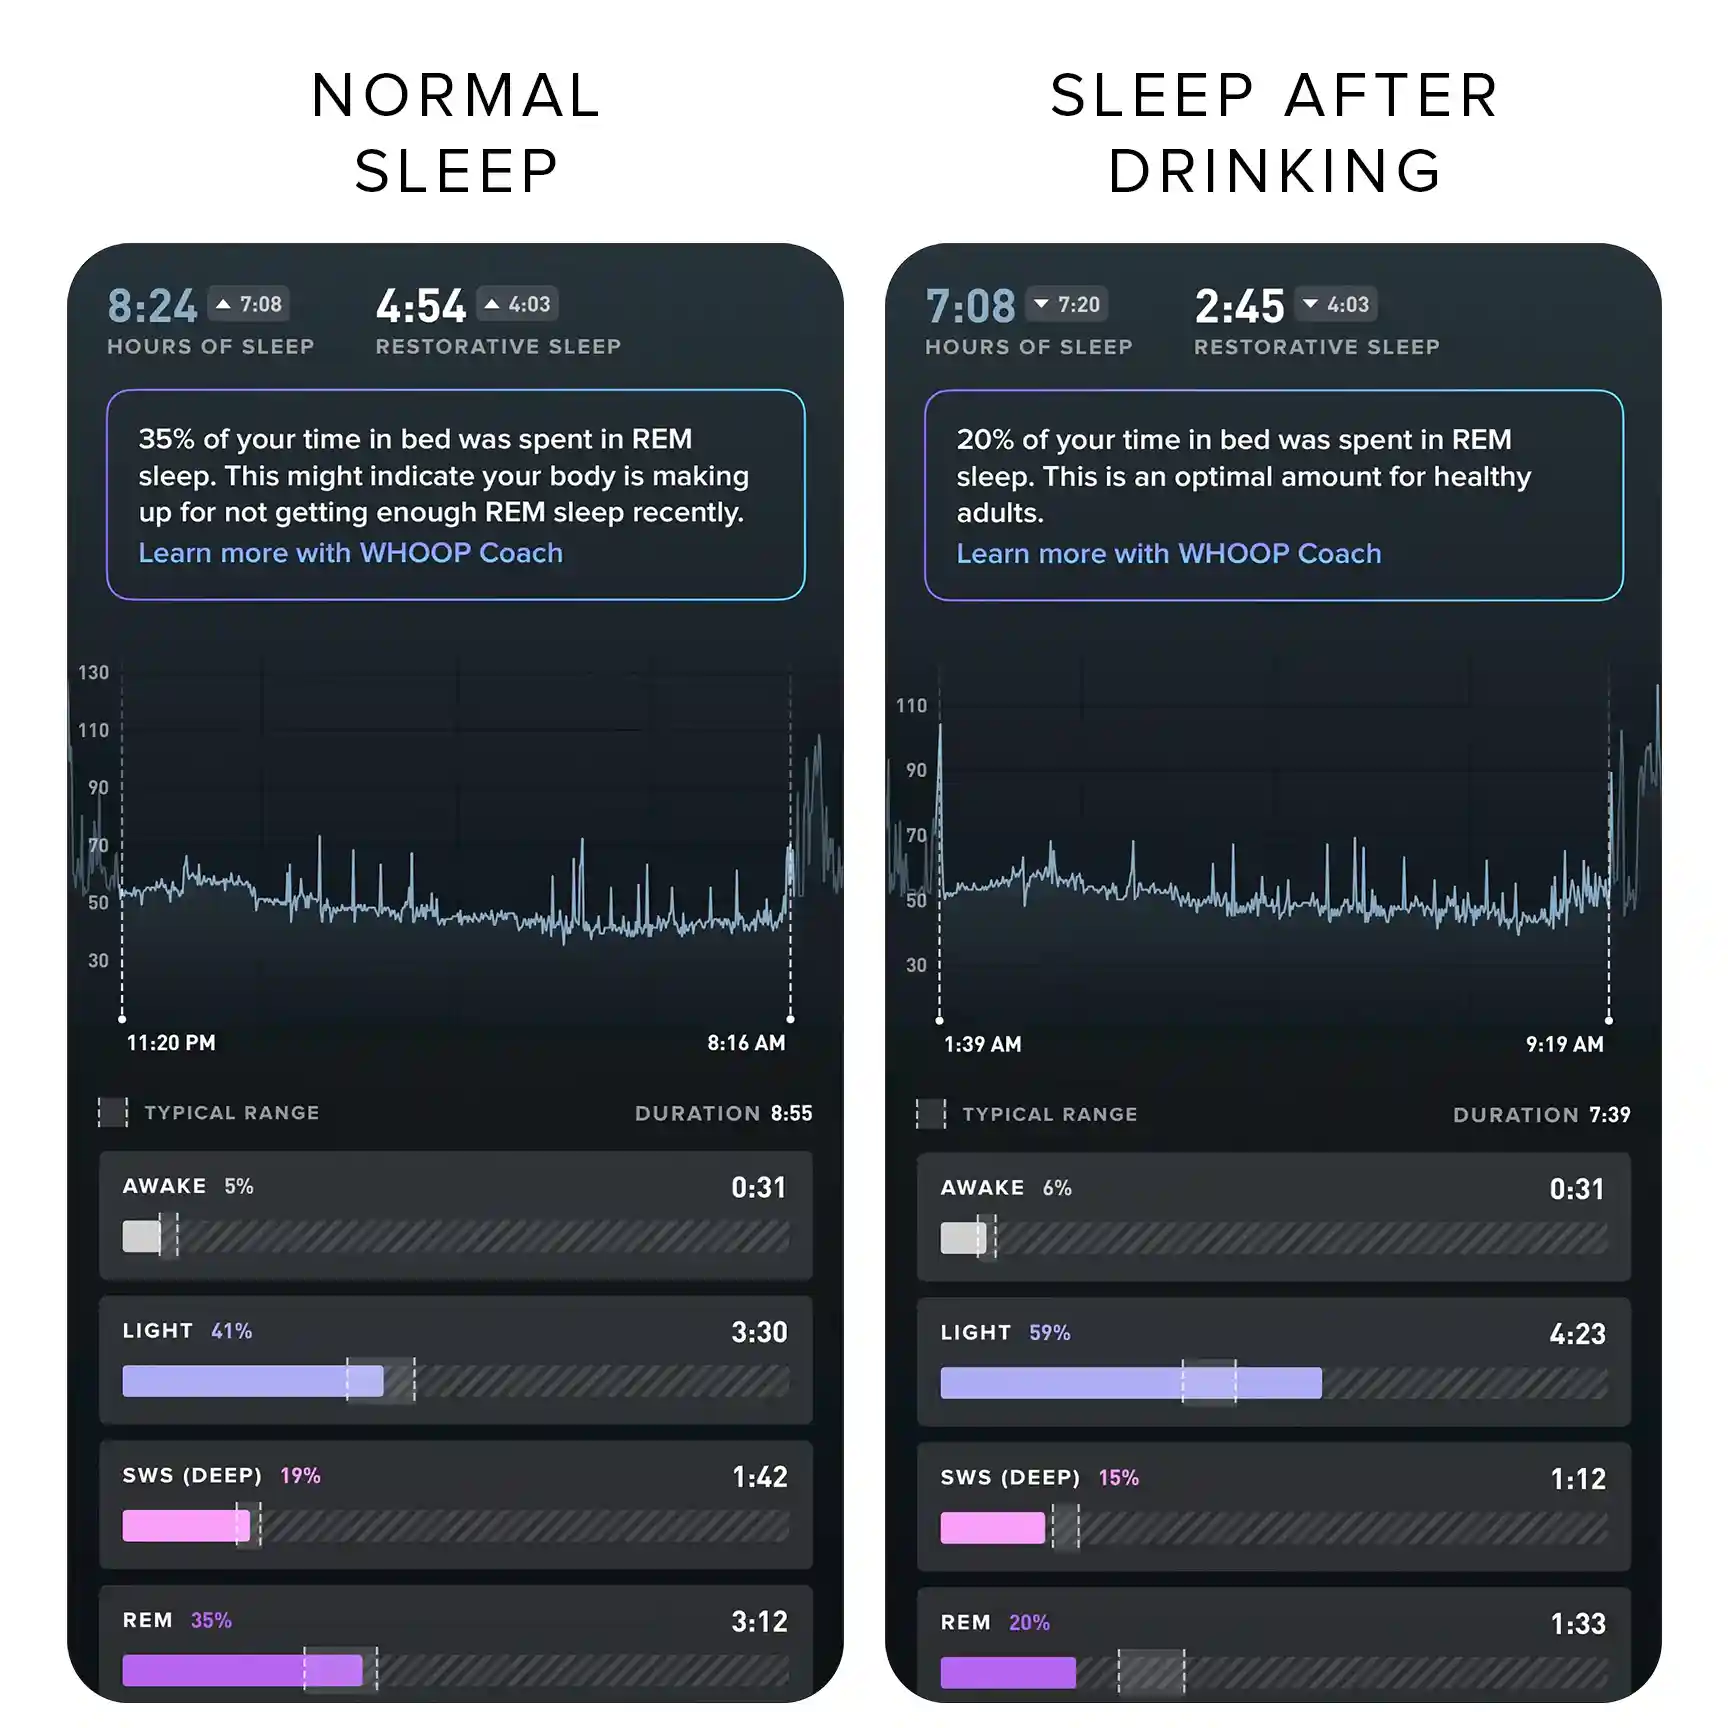
Sleep tracking has become a headline feature for all wearables. These devices monitor your total hours, sleep stages, and interruptions, then consolidate this into a sleep score. While accuracy can vary between devices, the biggest benefit is awareness—knowing you slept 5.5 hours instead of the 7 or 8 you aimed for often provides the nudge needed for better habits.
Focus on trends rather than obsessing over perfect sleep cycles. If you’re consistently low on deep sleep or your recovery score is declining, it may be time to prioritize rest. Like recovery metrics, you can often identify patterns in what contributes to good versus poor sleep quality, which is the real value of sleep tracking.
VO₂ Max: Your Fitness Ceiling
Perhaps the most performance-focused metric wearables provide is VO₂ max, your body’s maximum oxygen consumption during intense exercise. In simpler terms, it’s a marker of cardiovascular fitness and endurance capacity.
Your device estimates this based on heart rate patterns during activity. While it may not be as precise as laboratory testing, tracking your VO₂ max trends over time provides valuable insights. Improvements generally indicate building fitness, while declines might signal the need to reassess your training and recovery approach. Research has shown that VO₂ max is strongly associated with longevity, with higher cardiorespiratory fitness linked to reduced risk of mortality.
Closing The Loop: From Metrics To Action
The rise of wearables has given us more data than ever before, but numbers are only useful when you understand them. Strain, recovery, resting heart rate, heart rate variability, SpO₂, sleep, and VO₂ max each tell part of your health story. The real power lies in connecting the dots: knowing when to push, when to rest, and how to spot early signs that something needs attention.
The next time you check your wearable, look beyond steps and calories to these deeper insights. These devices evolved from companies with specific missions. Garmin transitioned from GPS technology, helping athletes track endurance sports, to comprehensive fitness tracking. Oura began with a singular focus on sleep, turning a simple ring into one of the most respected recovery trackers in the market. Apple Watch brought health metrics to everyday conversation. And Whoop built an entire platform around recovery measurement.
At their core, wearables aren’t about collecting data for its own sake; they’re tools designed to help you move, rest, and live more intelligently. Your body communicates through these metrics, and understanding that language is how you take control.